
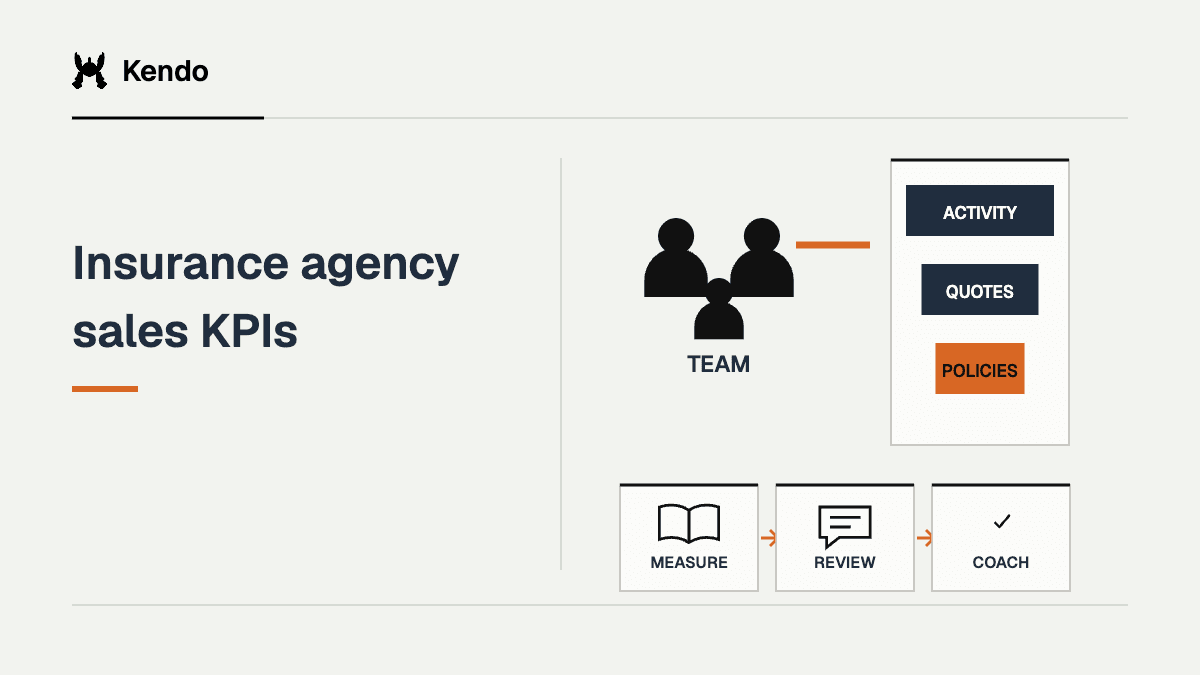

The best insurance agency KPIs answer one question: what should a manager do next? They cover the pipeline, production, retention and how ready each agent is. Start with contact rate, quote-to-bind, customer retention and one clearly defined production measure.
Before you set a target or compare producers, decide four things for every metric: what you divide by, which group you count, where the data comes from and who owns it. Better definitions usually matter more than another chart.
Agree on the counting rules before opening the dashboard
A dashboard lies when one office counts policies and another counts households. It also lies when you divide this month's binds by this month's quotes, because most of those binds came from last month's quotes. The goal is to find the next action, not to rank people on a number nobody defined.
Give every sales opportunity one ID that stays the same when the quote is revised or a second carrier is added. Decide whether a multi-policy account is one opportunity or several, then keep that choice all the way through the funnel.
Write down two dates: when an opportunity enters the cohort (the group you are measuring), and the date you check the result. A quote sent on the 29th needs time to resolve. Otherwise the producer who quoted most recently looks worse than one whose quotes have had time to close.
“Quote-to-bind: 31%.”
“Policies bound this month divided by quotes sent this month. Some of those quotes were from June.”
A rate without a counting rule is a guess with a decimal point.
Original coded illustration. Hypothetical figures.
For every rate you publish, show the two counts behind the percentage. A big swing based on a handful of cases should not look as convincing as the same swing across a large group.
The definitions below are a starting point, not accounting rules or industry benchmarks. Adapt them to your systems and write down any change before you use the numbers for pay or performance reviews.
Define five pipeline measures
1. Contact rate: are the assigned prospects reachable?
Formula: prospects you actually spoke with ÷ prospects you tried to reach in the same group × 100.
Owner: sales ops · Source: CRM and calling records
Sales ops removes duplicates, records attempt dates and defines what counts as a real contact. Count each prospect once in the time window, even if several calls connect.
Only about 1 in 5 US adults generally answers a cellphone call from an unknown number, so a low contact rate can be a reachability problem before it is a skill problem.
Survey of 10,211 US adults, July 2020. Published December 2020.
Source: Pew Research Center
Contacts divided by dials is a different number. Do not call it contact rate. Also keep prospects nobody could reach separate from prospects nobody tried.
An agency owner on a contact problem that looked like bad leads.

- 0:01Quotes dropped and the team blamed the leads.
- 0:05The real cause: the few phone numbers the agency dialed from got flagged as likely spam.
- 0:12The numbers were never registered for caller ID checks (STIR/SHAKEN) with the business details.
- 0:20Fix the calling setup first, then adjust one stage at a time.
A falling contact rate can be a phone-number problem before it is a lead or skill problem.
2. Meaningful-conversation rate: did contact become discovery?
Formula: contacted prospects who had a real conversation ÷ contacted prospects in that group × 100.
Owner: sales manager · Source: CRM outcomes plus call spot-checks
Define a real conversation by what happened on the call, such as the prospect explaining why they inquired and what they need. Call length alone proves nothing. Log the outcome in the CRM and spot-check calls so everyone counts the same way.
If contact is fine but this rate falls, check what the lead was promised and how the call opens. Before you hand the rep a new script, check whether the prospect even expected the call. If the opening is the problem, the insurance cold calling scripts show what a clean first thirty seconds sounds like.
Why contact does not turn into a real conversation, in under a minute.

- 0:00A few leads want a quote right now. Most are in the middle of something else when you call.
- 0:23Expect “I'm too busy right now.” It is the most predictable answer on the call.
- 0:30Offering to call back tomorrow usually reaches the same busy person.
- 0:38Find a way to help within the time they have, without annoying them.
A meaningful-conversation rate falls when the opening only works for people who already want a quote.
3. Quote rate: does qualified discovery reach a quote?
Formula: qualified opportunities that got at least one valid quote ÷ qualified opportunities that entered the group × 100.
Owner: sales ops and the quoting lead · Source: CRM and quoting records
Decide what “qualified” means before you know whether the deal closed. Record the quote date, and keep it as one opportunity even when several carriers quote it.
A low quote rate can mean missing paperwork, no carrier appetite or a quoting backlog. It is not automatically a discovery problem. Count each reason instead of quietly dropping those cases.
4. Quote-to-bind rate: do quoted opportunities become business?
Formula: quoted opportunities that bind by the agreed check date ÷ quoted opportunities in the same quote group × 100.
Owner: sales ops · Source: CRM records matched to the policy system
Hypothetical example: 20 bound opportunities ÷ 100 quoted opportunities = 20%. You divide by quoted opportunities, not all leads, all conversations or every revised carrier quote. Show how many quotes are still open and how old the group is next to the rate.
What most dashboards show
- Binds this month ÷ quotes this month
- Mixes quotes from three different months
- Goes up when last month was busy, not when selling improved
What a cohort rate shows
- Binds from May's quotes by 30 June ÷ quotes made in May
- One group, one deadline
- Shows how many of May's quotes are still open
Both are numbers. Only the cohort rate tells you whether quoting improved.
Hypothetical figures.
Sales ops decides whether any bind counts as a win on a multi-policy opportunity, and how partial wins show up.
When quotes stall, look at the proposal, the follow-up, the price and carrier appetite. A team can push its bind rate up by refusing every hard case, and that usually means less business, not more. The common insurance objections after a quote guide covers the conversation part.
Close rate is the quote-to-bind number most agencies fight over. One insurance team tracked its own version over six months.
Insurance case study: new-agent close rates went from about 33% to 60%+
Globe Life's new agents practiced daily with Kendo, alongside tighter hiring and manager oversight, over about six months.
“Kendo buys back time for my leaders”
5. Kept-appointment rate: did the scheduled meeting happen?
Formula: appointments actually held ÷ appointments scheduled for the same date window × 100.
Owner: appointment-setting manager · Source: calendar and CRM outcomes
The owner sets the rules for cancellations, reschedules, no-shows and double bookings. Keep the original appointment on record instead of deleting it after a no-show.
An appointment the setter logged is not the same as an appointment the business owner confirmed. Count the second kind.
Contact-to-appointment can be useful too. Define it separately: contacted prospects who book ÷ contacted prospects in the group. Booking and showing up answer different questions.
Track production without confusing premium and agency income
6. Time to first qualified production milestone
Calculation: the date the agent hit the milestone minus the date the clock started, in days. Pick calendar days or working days and stick with it.
Owner: HR, operations and the sales manager together · Source: hiring and production records
Choose a milestone you can see, such as the agency's approved first-production standard with its quality checks. Decide whether the clock starts at hiring, at licensing confirmation or when the agent is released to sell with supervision.
Also report how many hires have not hit the milestone yet, and how long they have waited. Counting only the hires who made it makes the number look better than it is. LIMRA data shows only 47% of multiline exclusive agents hired in 2020 were still with their company by 2023, so a milestone report built only on the people who stayed leaves out a large share of the cohort.
Multiline exclusive agents (P&C captive)Career channel (life)
- Multiline exclusive agents (P&C captive) still with their company in 2023: hired 2020, 47%; hired 2021, 53%; hired 2022, 69%; hired 2023, 87%.
- Career channel (life) agents still with their company in 2023: hired 2020, 16%; hired 2021, 21%; hired 2022, 35%; hired 2023, 79%.
LIMRA estimates, 2025 Distribution and Marketing Conference, slide 13. The two channels are different businesses; read each line on its own.
Source: LIMRA
For a mature group, show the median time among the agents who got there, next to the total group size, how many made it, how many left and how many are still working toward it.
The agent onboarding checklist helps separate paperwork and system blockers from real readiness.
Time to baseline is exactly the milestone this metric measures. United Insurance Pros tracked it before and after Kendo.
Insurance case study: time to baseline cut from 45+ days to 14 days
A 500+ agent organization measured how long new agents took to reach its own defined baseline.
“If you've got more than five agents, it's a no-brainer.”
7. Written premium per producer
Formula: written premium credited under the agency's stated rules for the period ÷ average producer full-time equivalents in that period.
Owner: operations or finance · Source: policy and agency reporting
Define new versus renewal premium, cancellations and endorsements, shared accounts and part-time producers. Do not switch from full-time equivalents to a plain headcount halfway through the year.
Written premium is not agency revenue. Premium can grow because of price changes, account size or business mix, not only better selling. Pair it with counts, retention and the service work the book needs.
8. Agency commission revenue per producer
Formula: agency commission revenue counted as revenue on your chosen accounting basis for the period ÷ average producer full-time equivalents in that period.
Owner: finance · Source: the ledger
Finance owns the accounting basis, chargebacks and who gets credit. Say whether the number includes fees or other income. If it does, name it that way instead of calling everything commission.
Do not mix written, received and booked amounts. Different lines and carrier payment timing change the comparison. This number shows agency economics. It says little about one producer's conversation skill.
Keep two retention measures separate
9. Policy renewal retention
Formula: policies renewed from the group due for renewal ÷ policies due for renewal in that group × 100.
Owner: retention operations · Source: the agency's policy system
The owner sets the check date and decides how rewrites, replacements, carrier non-renewals and pending outcomes count. New sales never enter the renewed count.
Keep every loss visible with its reason. Leaving out a whole class of hard renewals can be useful for a side analysis, but show the all-in number too. Otherwise a change in what you exclude can look like better performance.
10. Customer book retention
Formula: customers from the starting book still active at the closing date ÷ customers active at the starting date × 100.
Owner: account management · Source: the policy system, with duplicates merged
The owner decides whether a customer is a person, a household or a business, and merges duplicate records. A household that keeps one of its two policies is still a retained customer, while policy retention falls.
Use the customer-retention workflow to dig into the service, renewal and follow-through issues behind the number. Adding a policy through needs-based account rounding is a separate win, not proof that every existing policy stayed.
Measure training without mistaking activity for readiness
11. Completed practice assignments
Formula: assignments due in the period that were finished by the cut-off ÷ all assignments due in that period × 100.
Owner: the enablement lead · Source: the training system
The owner keeps the due dates and cancellation rules. Do not count every replay as a finished assignment, and do not push overdue work into next period just to lift the rate.
- STEP 1Assign
The roleplay gets a due date inside this period.
- STEP 2Finish
The rep completes it by the cut-off.
- STEP 3Count it once
Replays and late work pushed to next period do not count.
- STEP 4Check the score
Completion shows practice happened. The score shows whether skill moved.
Kendo's Training Paths show each rep's assigned roleplays and whether they finished them. That proves practice happened. It does not prove the rep uses the skill on real customer calls.
For how practice tools report completion versus scores, see the AI sales roleplay tools comparison.
12. Observed skill trend
Calculation: the average score on one scorecard criterion now, minus the average on the same criterion in the starting period, in points.
Owner: the sales manager · Source: scored calls on one scorecard version
Show both sample sizes, the scorecard version, the date windows and the call type. Keep practice separate from customer calls. A new rubric, a harder scenario or a different set of reviewed calls can move the trend without any change in skill.
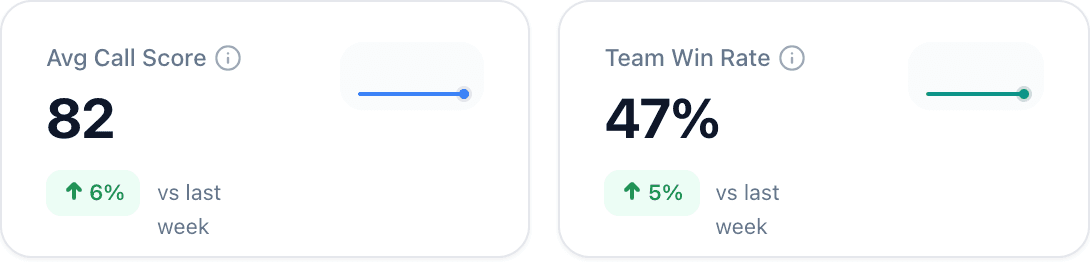
Kendo's team analytics. A trend only means something when the scorecard, the call type and the date window stay the same on both sides.
Kendo's custom scorecards let you define and weight the criteria, and its team analytics show training and performance views. Managers still read the transcript and settle scoring disputes before acting on a trend. The sales coaching software guide shows what review tools automate and what they leave to the manager.
A useful side measure is coaching coverage: reps who got a coaching review ÷ reps who should have had one. Define what counts as a review. Sending written feedback nobody discussed should not count.
Gallup finds 80% of employees who got meaningful feedback in the past week are fully engaged, which is why a coaching coverage count belongs next to the skill trend.
- 80%
- of employees who got meaningful feedback in the past week are fully engagedGallup
- 70%
- of the difference in team engagement comes down to the managerGallup
Gallup. Engagement, not sales results, and an association rather than a cause.
Compare like-for-like cohorts before judging performance
Split producers by lead source, lead age, line of business, tenure, location and time window before comparing them. A new producer working older outbound leads should not be ranked against an experienced producer handling referrals.
Keep each cohort (the group you are comparing) large enough to read, and show the raw counts when it is small. No single minimum sample size makes every agency comparison reliable. Treat a small change as a reason to look at the records, not as a verdict.
One rep's number is never the team's number. Kody Skvarla's team is the clean example of reporting both.
Insurance case study: a 5 to 20% team lift, and one rep who doubled his own baseline
The wider team reports a 5 to 20% improvement. One top performer roughly doubled his own baseline.
“Kendo matches or beats a human practice partner. The objections are the exact same as real calls.”
Turn insurance skill scores into coaching with Kendo
A weak KPI starts an investigation, not a verdict. Review the call evidence, choose one behavior and assign practice in Kendo. Keep the skill score separate from binds and revenue when you check the next attempt.
Buyer Profile
Define who the buyer is and the context they make decisions in.
Scenario & Resistance
Set what is being sold, the conversation stage, and how this buyer should resist.
Insurance Follow-Up: Clear Next StepACTIVE



Select team members to start this training path
You sent the quote, but I don't know what happens next.
What would you need cleared up before you decide?
The deductible difference. And my partner needs to be there.
Let's go through the quote with both of you. Does Thursday at six work?
Kendo's team training view: each rep's assignment, score target and progress.
| Pattern | First evidence to inspect | Possible action if confirmed |
|---|---|---|
| Low contact, stable conversion after contact | Lead age, attempts and reachable records | Fix routing or calling setup before assigning closing practice |
| Healthy conversations, few quotes | Missing information and submission status | Repair the handoff, the market-fit screen or the discovery questions |
| Strong binds, rising early losses | Issue groups and loss reasons | Look at expectation-setting, service and product fit with qualified staff |
Look at the record or the call before picking a fix. The insurance calling examples help when the evidence points to the conversation. They cannot fix bad lead data.
Pick the one metric the team argues about.
Read its counting rule out loud.
Pull five records and check them together.
Agree one action and one owner.
Set the date you will look again.
Note any change in lead supply, staffing or carrier availability before the next review. That fixes more than another dashboard.
For the training part, the insurance coaching workflow connects the weak spots you see with practice and review. Binds, premium, commission and retention stay tied to their own source systems. Do not assume those systems match up on their own.
Before adding another dashboard, the AI sales tools comparison separates sales-management, coaching and prospecting tools so each metric has the right source.
Frequently asked questions
Which insurance agency KPIs should leadership review first?
Start with the number tied to the decision you need to make: contact rate for reachability, quote-to-bind for what happens to quotes, or retention for the existing book. Agree on what you divide by, which group you count, the source and the owner first. A short scorecard everyone trusts beats a long list of disputed percentages.
Can we divide this month's binds by this month's quotes?
That mixes quotes from different months. For a quote-to-bind rate, follow one group of quotes to a set check date and show the ones still open. A monthly activity ratio can be useful, but do not call it a cohort rate.
Are call scores a substitute for production metrics?
No. Call scores describe how a call went against one scorecard and one set of calls. Binds, premium and commission revenue describe different results. Use both without merging them into one number, and keep scorecard versions, sample sizes and source systems visible.
How should managers compare new and experienced producers?
Split out the real differences first: tenure, lead source and age, line of business, market and time window. Show counts when samples are small. Compare similar work before judging the person, then look at the records or calls to choose a coaching or operations fix.